blog
Bookmark This! Introducing the New Center City Data Dashboard
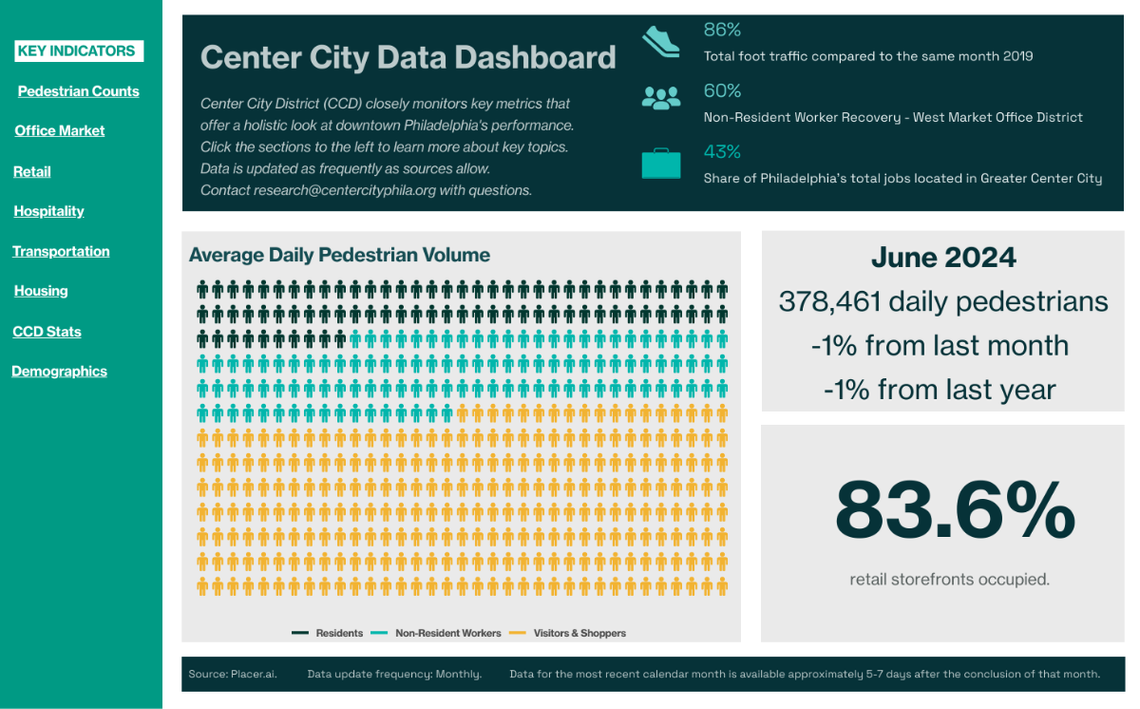
Center City District is rolling out a new way to keep tabs on the different sectors and key performance indicators that contribute to the economic health and vitality of downtown. The Center City Data Dashboard will serve as a reference and go-to source for any stakeholders wanting to understand the latest and greatest numbers across a variety of topics including pedestrian volumes, apartment and office leasing, and CCD's own efforts around cleanliness and safety.
Why We’re Introducing It
In last spring's State of Center City report, CCD President and CEO Prema Katari Gupta posited that we ought to stop talking about recovery and instead better understand the present and plan for the future. Accordingly, this dashboard helps CCD to achieve this and several other goals:
-
It offers our stakeholders the chance to understand current (or at least very recent) trends rather than relying on snapshots published at a single moment in time;
-
It creates an accessible reference for those in government, policy, media, and other sectors that frequently request or rely upon the data we collect; and
-
It aggregates information from a variety of data sources and civic partners in a single location.
"Many of our stakeholders look forward to our State of Center City report each year to understand how our downtown has evolved over 12 months. But Center City is always changing, so there’s also a big appetite for understanding what’s happening in the interim," notes Clint Randall, Vice President of Economic Development at Center City District.
“The Dashboard will allow property owners, public officials, policy advocates, media, and others to understand momentum and movement on everything from foot traffic to office leasing, hotel stays and store openings. We’re excited for this to be a resource and reference guide for anyone with an interest in understanding the real-time dynamics of downtown,” he continued.
The Dashboard, At a Glance
Today, the Data Dashboard is launching with 9 interactive pages of information covering key indicators, pedestrian counts, the office market, retail, hospitality, transportation, housing, CCD stats, and demographics. Additionally, our Economic Development team can expand and adjust the dashboard to highlight emerging trends and to showcase our latest research findings. Using the table of contents on the left, viewers can jump to specific topics of interest or peruse the dashboard in its entirety.

From this first iteration, a few key takeaways noted by our research team include:
-
Trophy-class office buildings are nearly 90% occupied;
-
Non-resident workers are back at their highest levels since last June;
-
Indego bikeshare saw nearly half a million trips in the first half of 2024; and
-
The absorption of apartment units in core Center City is still net positive, with apartment occupancy climbing to 92%.
Aside from aggregating this publicly available data in a more digestible format, this dashboard will also actively share information from CCD’s own on-street operations. Of note in this first iteration, we’re excited to share that cleaning crews have cleaned nearly 500 instances of graffiti and Community Service Representatives (CSR's) have assisted more than 25,000 people in navigating downtown.
The dashboard would not be possible without our partners and vendors which are cited throughout, including Placer.ai, CoStar, STR, SEPTA, PATCO, Indego, and the U.S. Census Bureau. The dashboard also relies upon the data collected by our own Community Service Representatives (CSRs) who now use a tablet-based system to log the thousands of interactions they have on the street with visitors, workers, and residents, as well as the tireless work of our cleaning crews.
Share Your Feedback
As you explore the Center City Data Dashboard, please don't hesitate to reach out to the Economic Development team at research@centercityphila.org. The team can answer questions, dig deeper into select topics, and even improve and expand the dashboard based on feedback.
