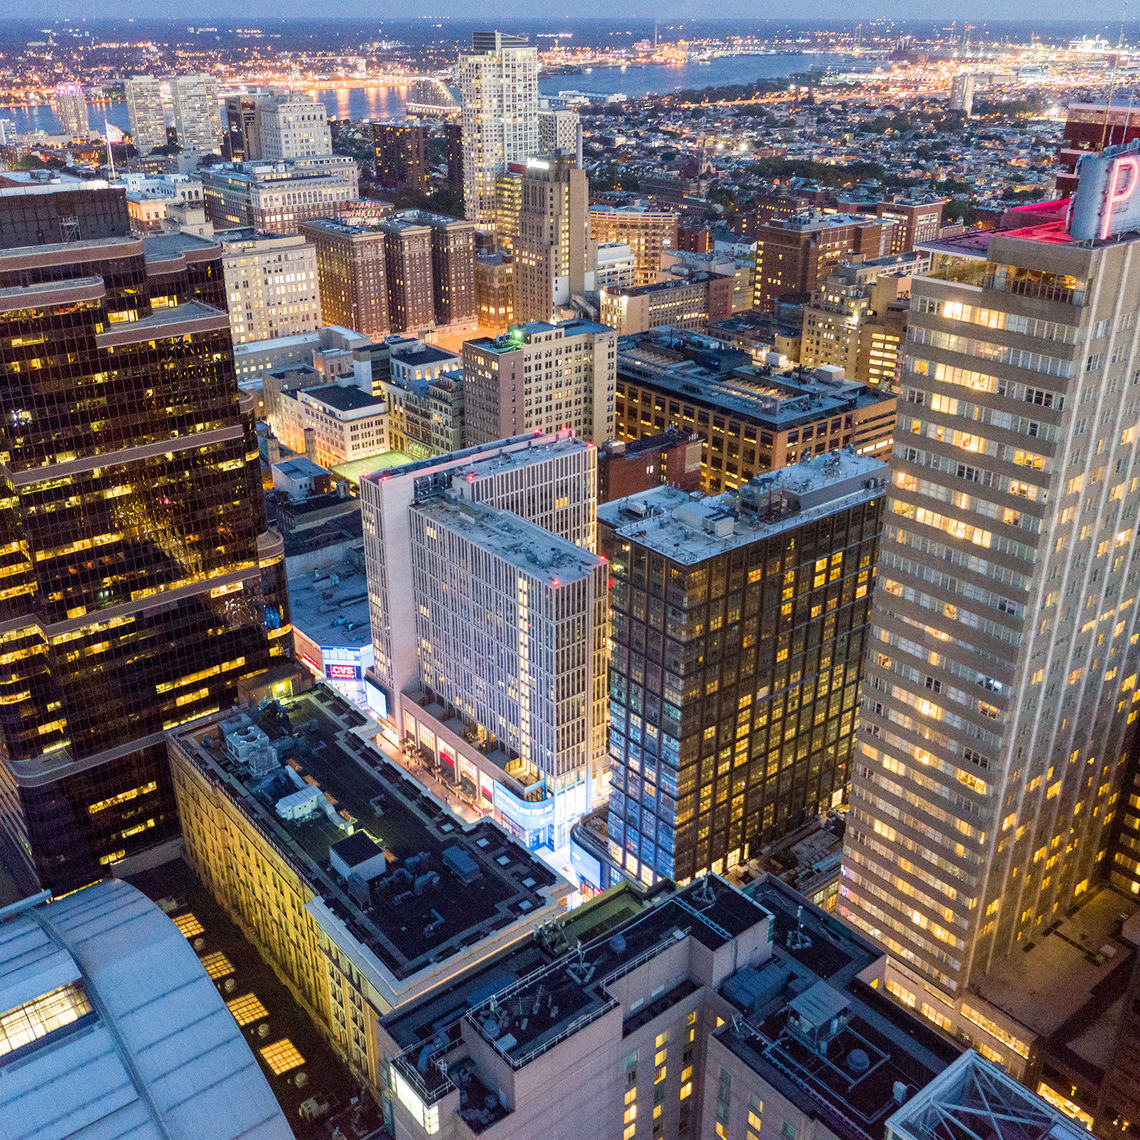
The Center City District (CCD) and Central Philadelphia Development Corporation (CPDC) have released Building Out From The Core: Housing Report 2019, examining housing development in Greater Center City (the area between the two rivers and from Girard Avenue to Tasker Street) and in immediately adjacent neighborhoods; documenting the impact of employment growth and demographic trends on recent development; and looking at affordability issues in a comparative context.
Greater Center City experienced another record-setting year in 2018 with the construction of 2,810 new housing units- the largest number since Center City District began tracking the market almost 20 years ago. The majority of housing built in and around the downtown during the past eight years focuses on renters: 72% of the new housing units added since 2010 are apartments (10,660 units); 4,143 for-sale condominiums and single-family homes were delivered during the same period. An additional 3,000 units are under construction, or recently completed, in the 19121, 19122 and the 19125 ZIP codes immediately north of Girard Avenue. But new housing development is highly concentrated in a limited area of the city: 46% of new units in Philadelphia are in Greater Center City, and 80% are being built in Greater Center City or its five adjacent ZIP codes – an area comprising just 17% of the city’s geography.
Outside of this area, persistent challenges remain. The city still loses 7,000 more individuals to the suburbs annually than it gains, including a significant percent of households without children. More households making over $100,000 continue to move out than move in. Lower income families in Philadelphia face major affordability challenges that are due primarily to low incomes, rather than a reflection of high rents or high sales costs. Philadelphia has more than 200,000 cost-burdened households who make $50,000 or less per year, but only 33,339 affordable subsidized units.
Despite a lot of focus on rising housing prices, in 2018, 78% of the houses sold in the city were priced at $250,000 or less. Only 0.4% were priced over a million dollars. Between 2010 and 2018 only 1,593 out of 158,863, or just 1% of the residential sales transactions citywide were for more than $1 million.
Philadelphia thus needs to tread carefully with efforts that raise the cost of living and working in the city. There is a significant difference between the local redistributive capacity of cities like San Francisco which has a median income of $110,800 and has grown jobs annually at the rate of 3.4% since 2009, or Seattle, median income of $86,800 and which has grown at 2.6%, or New York City with median income of $60,900 and which has grown at 2.5% and Philadelphia’s median income of $39,800 and growth rate of 1.5%, 23rd slowest of the country’s 25 largest cities, despite the acceleration during the last few years. Faster growth, more jobs and rising incomes should be the top priority for Philadelphia’s leaders both to improve housing opportunities for lower income households and to retain our time-limited surge of Millennials in the city.
What’s in the pipeline? How does Philadelphia compare with other cities? Using data from city, state, and federal sources along with extensive original research on housing construction, Building Out From The Core: Housing Report 2019, provides a range of data useful to developers, lenders and those who shape public policy.
In the News
February 19, 2019 | Strongest growth in housing production in Center City Philly area since 2002, new report finds, philly.com
February 19, 2019 | Record number of housing units built in Center City last year — but not enough to offset old trends, PhillyVoice
February 19, 2019 | Record number of housing units added in 2018, most from core of Center City, KYW Newsradio 1060
February 21, 2019 | Report: Bright spots in Center City housing market but room for improvement, Philadelphia Business Journal
April 26, 2019 | From the Editor: Conventional wisdom isn't always wise, Philadelphia Business Journal