digest
Center City Digest, Winter 2018
Cautious Optimism
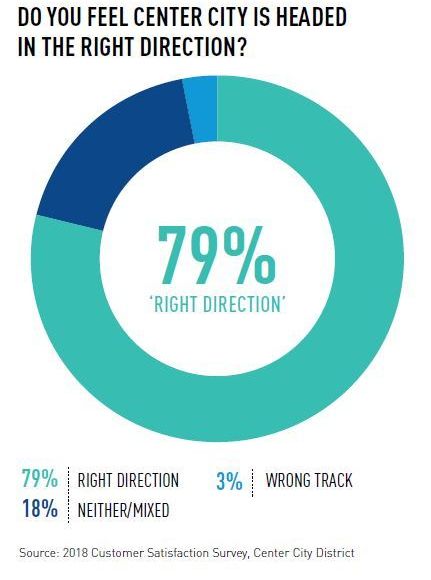
People who work, live, shop or dine in Center City are quite optimistic about downtown’s future. That’s apparent in the Center City District’s annual customer satisfaction survey, where 79% of the 4,640 respondents say downtown is headed in the right direction. Only 3% feel it’s on the wrong track, while 18% don’t sense things trending significantly either way.* Attitudes about the city as a whole are also upbeat at 62%, but 17 points lower than confidence in downtown, the location for 42% of Philadelphia’s jobs, a burgeoning scene for new businesses and residents, new hotels and restaurants and a continuing surge of new construction.
Inside This Issue
- Cautious Optimism
- Winter in Dilworth Park
- Fall Clean-up at Sister Cities Park
- Pulse Debuts in Dilworth Park
- Plant Center City
- New Fountain at Dilworth Park
- Combined Outreach Program Update
- Thank You For Your Support
CAUTION FLAGS:
But, there are caution flags. While 79% indicate they feel safe most of the time or always in Center City, 20% say they often, or occasionally, feel unsafe. Fifty-nine percent say panhandlers who confront pedestrians cause the greatest insecurity; 47% are concerned about people sleeping on the sidewalks and in building entrances; and 31% worry most about the absence of uniformed police officers or other public safety professionals. Because street behavior is a much debated issue, the survey also offered respondents the choice: most of these items are part of urban life and do not bother me. Only 24% selected this option.
Respondents include both individuals who work or live in Center City, as well as those who come just for shopping, dining, tourism and entertainment. Among respondents who are continually in Center City because they work or live here, concerns about panhandling and homelessness rise to 64% and 50% respectively, with just 22% selecting the do not bother me option.
These concerns have more than doubled from similar surveys in the last five years. This increased anxiety reflects less a shift in public attitudes than changing realities on the street, documented by censuses CCD has conducted within District boundaries for more than two decades.
In June 2008, 54 homeless individuals were on sidewalks in the core commercial area of downtown during daytime hours. In June 2013, the count had increased to 74; in June 2018, the number had grown to 138. This does not include people in the subway concourses, train stations or under highway bridges.
The police overnight count in June 2018 for the larger area between Spring Garden and Spruce streets, river to river, was 505, including the underground and areas beneath Convention Center and highway bridges, As panhandling surges with the opioid crisis, counts have risen from 11 such individuals in the core of downtown during lunchtime hours in June 2008, to 24 in June 2013, to 69 in June 2018.
The highly successful, combined outreach effort funded by the Center City District in partnership with Project Home and the Philadelphia Police Department with strong support from City’s Department of Behavioral Health has resulted since April in 134 individuals choosing to come off the street and enter social service, mental health and housing programs (see article on page 9 of Center City Digest). As a result, counts have come down since the early summer. Still, some return to the street, new individuals steadily arrive, while resources off-street are periodically constrained.

QUALITY OF LIFE:
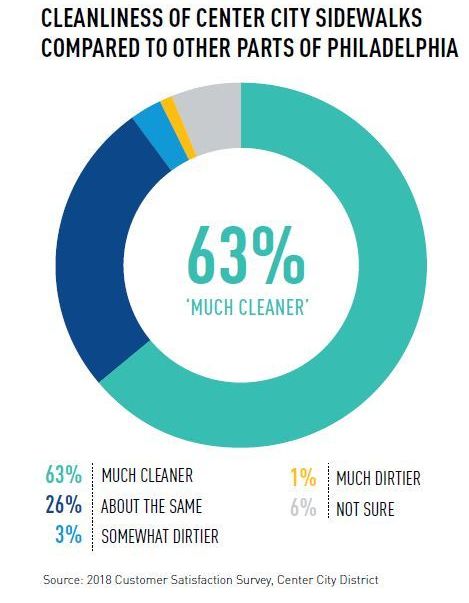
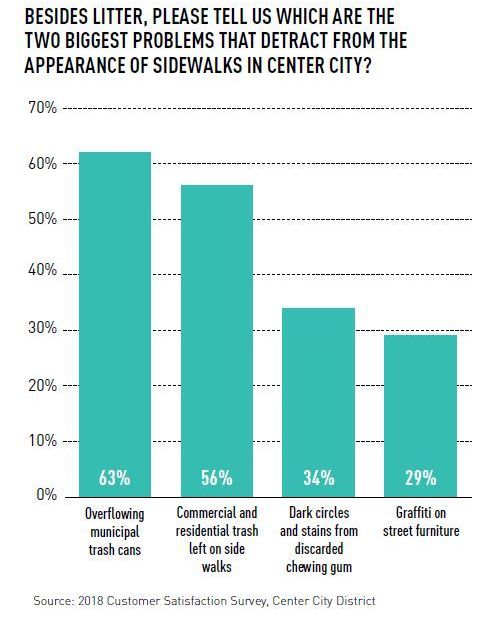
Seventy-one percent of survey respondents see CCD personnel every time or most of the time they are in Center City and 63% think downtown has far less litter than other areas of the city. When asked, “Besides litter, which are the two biggest problems that most detract from the appearance of sidewalks in Center City,” 62% pointed to overflowing municipal trash cans; 56% note commercial and residential trash left on sidewalks; 34% commented on the dark circles and stains from discarded chewing gum; and 29% expressed concern about graffiti on street furniture like trash cans, postal boxes, parking kiosks, electrical utility boxes and traffic signs. Among respondents who live in Philadelphia, 67% checked overflowing trash cans.
The CCD was formed to supplement, not replace, City services. As pedestrian volumes have risen on prime shopping streets by as much as 30% in the last five years, we have increased sidewalk sweeping and lengthened operating hours. But as municipal resources have been curtailed and government priorities have shifted, CCD has also stepped up to support homeless outreach efforts and to fund graffiti removal – not only from ground floors of building facades within the District and from the streetscape enhancements we have installed, but we have also started to clean the City’s Big Belly trash cans, the Parking Authority’s kiosks, bus shelters, traffic boxes and UPS/FedEx/USPS mailboxes – all things that technically are someone else’s job. We continue to urge basic enforcement of sanitation ordinances and codes that govern the condition of commercial dumpsters. But in 2019, we are budgeting for increased deployment of cleaning and public safety crews, more frequent graffiti removal and pressure washing, and an expanded version of this year’s homeless outreach initiative. Internally, we debate the long-term implications of crossing the line between supplementing and replacing, but worry about the consequences if we don’t. We welcome your thoughts on this question.

IMPROVING THE PUBLIC ENVIRONMENT:
Beyond the essentials of clean and safe, the customer satisfaction survey asked questions about improvements to the public environment and about competitiveness. During the last two decades, CCD has installed hundreds of directional signs, thousands of pedestrian-scale light fixtures and several hundred street trees and planters. We improve, maintain and program five parks.

Eighty percent of all respondents (and 84% of city residents) have visited Dilworth Park, 37% of all respondents (and 41% of city residents) have been to Sister Cities Park, 22% have visited Café Cret, and the same percent have walked on the Rail Park, which just opened in June, while 21% have walked in Collins Park. Eighty-nine percent think these parks are positive additions to Center City; 9% view them as improvements that are not convenient or attractive to them personally, while 1.7% don’t think they are a good use of CCD resources.
When asked, “What other changes to the public environment would most improve Center City as a place to work or live,” 59% responded: better manage and reduce the amount of traffic congestion; 41% want property owners to repair their deteriorated sidewalks; 38% cite the condition of dumpsters in service streets and alleys.
Items 2 and 3 above can be achieved without much public expenditure, if the City would devote more attention to quality-of-life enforcement in Center City, even as they wrestle with the catastrophic impact of opioid addiction in parts of the city and the critical, life-safety challenges in many lower income neighborhoods. Good governance is about recognizing that needs in different portions of the city are different, that one size does not fit all; and most importantly, that addressing quality-of-life issues in the 8% of the city’s geography that provides more than 50% of the municipal tax base is essential to Philadelphia’s ability to fund public services and schools everywhere else.
CONGESTION:
Traffic congestion is a problem of abundance, the byproduct of success: more residents, more jobs, more pedestrians, more delivery trucks, more cyclists and more people using Uber and Lyft. However, problems of success are no less compelling than challenges of scarcity: insufficient jobs, inadequate incomes or the shortage of quality, affordable housing. We neglect congestion at our peril, since funding from higher levels of government is steadily declining for problems of scarcity. We either improve the coordination of our fragmented system of transportation management, dedicate revenues from enhanced enforcement to management and technology upgrades, or we will reach a tipping point at which those who work or
visit Center City start choosing not to do so.**
ENHANCING COMPETITIVENESS:
When asked, “Which three improvements would enhance the competitiveness of Center City as a place to work or to start/expand a business, improve public schools came in first with 59%; reduce the wage tax was selected by 52%; reduce traffic congestion came in third with 49%; reduce the number of people living and/or panhandling on Center City sidewalks was close behind with 48% and reduce the Business Income and Receipts Tax (BIRT) was selected by 21%.
For those who live or work in Center City, concern about the wage tax rises to 56% and schools come down a notch to 58%. For those who own businesses, concerns about BIRT rise to the number two position at 57% just behind schools at 60% and ahead of concerns about the wage tax at 52%.
MILLENNIALS ARE NOT FOREVER:
Center City reaps enormous benefits from an expanding cohort of young professionals: 46% of residents between Vine and Pine streets, river to river, are between the ages of 20 and 34. In the neighborhoods that extend north to Girard and south to Tasker Street, that age cohort has swelled to 37% of the population. This demographic is filling new apartments, driving demand for retail, bars and restaurants, and, given their high level of educational attainment, attracting employers to downtown.
For those with distinct memories of the 1980s, when gutters on residential streets surrounding downtown were filled each morning with shards of glass from broken car windows, when retailers rolled down security gates on Chestnut and Walnut Street by 5:30 p.m. and employers were fleeing for the suburbs, it’s worth underscoring that the oldest of today’s millennials were in third grade in 1990. So it shouldn’t be surprising if they take the vitality and nightlife of Center City for granted. That too is a sign of success: America’s largest cohort knows only cities where downtowns are thriving, even if that accentuates concerns about poverty
and equity.
But no one should mistake the presence of millennials in Philadelphia as a sign that the tide has fully turned. Start with the obvious: as people age and incomes rise, values and needs change. While millennials place public schools highest on the competitiveness question, scoring it at 64% and ranking reduce the wage tax at 56%, 35-54 year-olds put the wage tax first at 59% and public schools second 58%. Obviously, each is very important. However, across the city in both white and African-American communities, twice as many households earning over $125,000 annually are moving out of Philadelphia as are moving in. The tide may be coming in young downtown, but it’s not enough to offset older trends elsewhere in the city. Eighty-one percent of households that left Philadelphia between 2010 and 2016 do not have children. Job opportunities that allow workers to shed the wage tax remain quite alluring.
Second, the age cohort behind millennials is somewhat smaller, so the volume of young people to replenish the city will taper down over the coming decade. Third, several untended quality-of-life issues matter greatly to millennials: 64% rate managing traffic congestion as top priority, compared to 59% for the entire sample and 55% for those 55 years of age and older. Forty-four percent of millennials place a high priority on cleaning up service alleyways, seeing their potential as animated, pedestrian lanes, compared to 38% for the sample as a whole and 34% for those 55 years and older. On issues of panhandling and homelessness, there is no significant difference between the rankings of millennials (57% and 45% respectively) and the overall sample (59% and 47%). It is also notable that while only 22% of millennials seek more visible, uniformed security professionals to enhance safety, the number rises to 33% for 35- to 54-year-olds and 38% for those over 55.
The good news is that while millennials are slightly more optimistic about the direction of Center City than Philadelphians as a whole, they are substantially more upbeat about the direction of the entire city, as they continue to explore and move to neighborhoods that two decades ago were overcome with abandonment and deterioration. If job growth was more on pace with Boston, New York and Washington, if accelerated cuts to wage and business taxes were restored, we’d be creating more opportunity for all city residents and enjoy an expanding real estate tax base to support public schools. With greater attention to behavioral and quality-of-life issues, we’ll keep many more people in Philadelphia as their incomes rise and families and businesses grow. Now is the time to lock in the dividends of favorable market and demographic trends while they favor places like Philadelphia.
Paul R. Levy
President
plevy@centercityphila.org
* The Customer Satisfaction Survey took place in October and November. More than 6,000 postcards with an online link were distributed: 2,000 to pedestrians in Center City, 1,000 mailed to downtown commercial property owners and 3,200 to residential owners in the District. An ad for the survey appeared in the fall Digest, mailed to 9,632 business owners, workers and residents. A social media and email campaign through several CCD social media accounts spanned the eight-week period; four “special edition” emails were sent to all 93,000 of our email subscribers throughout the region. In addition, we conducted five days of on-street interviews at nine locations (Dilworth Park, 18th & Walnut, 13th & Sansom, 19th & Market, Comcast Center, 10th & Chestnut, 12th & Market, Collins Park, Sister Cities Park). Some survey totals exceed 100% for questions in which respondents could choose more than one answer.
** See CCD/CPDC’s 2018 transportation report, Keep Philadelphia Moving, for recommendations.